Interface and navigation
Home · Interface and navigation
Goal
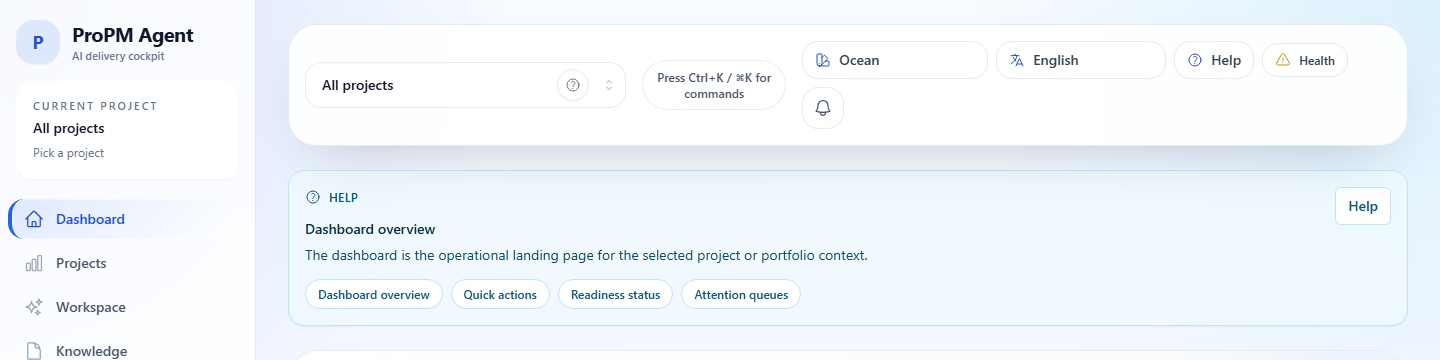
This page explains how to navigate ProPM Agent: main navigation, active project, notification center, health indicator, command palette, language, theme and help.
Who this page is for
| Profile | Use this page to |
|---|---|
| Business user | Find the right page and understand empty states |
| Project Manager | Switch project before acting and follow notifications |
| Project Owner | Quickly diagnose role, project, health or integration issues |
| Support | Collect first-level clues without technical administration details |
Main surfaces
| Need | Open |
|---|---|
| Read project status | Dashboard |
| Select or create a project | Active project |
| Add or search documents | Knowledge |
| Run AI | Agents |
| Review deliverables | PM Documents |
| Audit a run | AI Log |
| Handle a signal | Signals and notifications |
| Approve an action | Actions and approvals |
Switch active project
- Open the project switcher in the top bar.
- Search for the project if the list is long.
- Select the project.
- Confirm that its name appears in the top bar.
- Open Dashboard to verify the context.
- Continue in Knowledge, Agents, PM Documents, Signals or AI Log.
Notification center
- Open the bell icon.
- Read unread notifications.
- Select a notification to open the linked page when available.
- Use Mark all read to clear the counter.
- Use Clear only when the local list is no longer needed.
- If the linked page is empty, check active project and permissions.
Health indicator
| State | Meaning | Action |
|---|---|---|
| API healthy | Services respond | Continue normally |
| API degraded | Some pages may load slowly or stay empty | Wait, note the time and retry |
| Realtime degraded | Notifications may lag | Refresh if needed |
| Auth issue | Session or tenant needs attention | Return to Getting started |
| High latency | Actions may be slow | Avoid duplicate clicks |
| Blocking message | Live API may be unavailable | Open Support diagnostics |
Language, theme and help
Language changes labels, not project data. Theme is local comfort. Some preferences such as recent project, language, theme and notification read state can stay local to the browser.